Overview
The MPO has developed the Broward Complete Streets Master Plan (CSMP) to guide future investments by creating a prioritized list of projects based on technical, data-driven analysis and community input. Feedback from Broward residents and partners is key to developing a list of projects that meet the needs of local communities.
How was this Plan put together?
The Master Plan provided opportunities for transportation partners’ input throughout the duration of its development such as the Project Advisory Committee (PAC). The PAC was formed as a working group of the Complete Streets Advisory Committee (CSAC) to gain input from the Broward MPO and its partners.
The Master Plan framework included:
- A best practices review to identify master plan elements to incorporate into the project development.
- A map series prepared using available geographic information systems (GIS) data.
Transportation Network Analysis
Mapping techniques helped to identify problem spots and network gaps.
The GIS data map series was developed utilizing information gathered from the literature review, stakeholder involvement, socioeconomic statistics, and past projects. The maps illustrate key mobility conditions within Broward County.
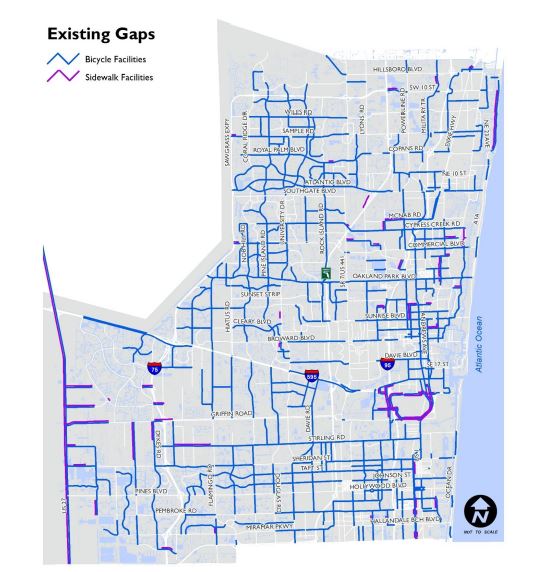
Existing facilities in Broward Region
A comprehensive review of the existing gaps, approximately 327 miles, of which 54 miles correspond to sidewalk gaps. The Complete Streets Master Plan has the intention of closing gaps, creating a complete and user-friendly network. Click below to view the existing gaps in the bicycle and pedestrian network.
CLICK HERE for a table of the list of gaps identified by the CSMP
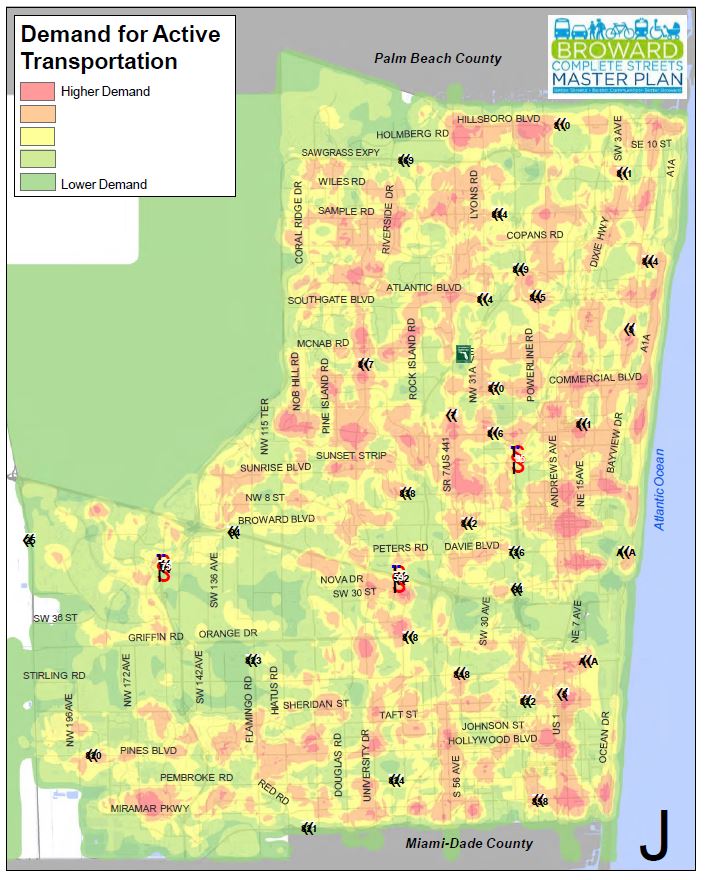
To quantify and visualize demand for bicycle and pedestrian travel county-wide, a bicycle and pedestrian demand analysis was completed. The demand analysis is an objective, data-driven process that estimates the cumulative demand representative of where people live, work, play, learn, and access transit by quantifying factors that generate bicycle and pedestrian movement. Providing a general understanding of expected walking and biking activity by analyzing spatial data representative of origins and destinations in the County. The demand model’s scoring method is a function of density and proximity. Scores are a result of two complementing forces:
-Distance decay: The effect of distance on spatial interactions yields lower scores for features farther away from other features.
-Spatial density: The effect of closely clustered features yields higher scores.
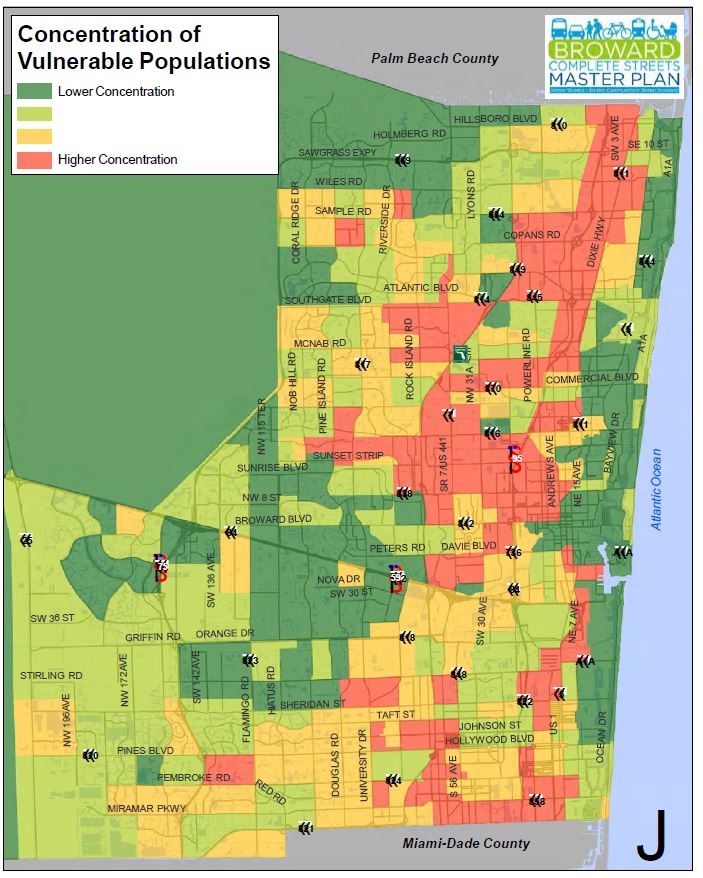
The equity analysis considers demographic factors, which when combined, indicated where there are concentrations of historically vulnerable populations. The equity analysis for Broward County uses a combination of six socioeconomic indicators from the United States Census Bureau to identify where vulnerable populations are concentrated. Those six factors include: Age, Income, Language, Race, Education, and Commute.
Demand
The demand model’s scoring method is a function of density and proximity. Areas that have more features and features that are closer together have higher scores. Low feature density areas and areas where features are further apart receive lower scores. Composite demand is calculated by summing all five categories: Live, Work, Play, Learn, and Access to Transit. All categories are given the same weight in the Composite Map. The analysis reveals high demand areas exist throughout the County, yet in a distributed manner with little areas of concentration. Areas with higher demand concentrations are located in Hallandale, Fort Lauderdale, Sunrise, Tamarac, and Coral Springs. Additional hotspots that are more distributed throughout the county are located in Deerfield Beach, Pompano Beach, Lauderhill, Dania Beach, and Davie. Many other hotspots are located in various geographic areas.
Click below to view the Composite Active Transportation Demand Map
Equity
The composite equity analysis results identify areas that demonstrate a relative need for transportation investments based on concentrations of historically vulnerable populations. While this analysis does not directly assess access to existing walking and bicycling facilities, the results identify areas where more facilities may be needed, or where access to existing facilities should be improved.
Click below to view the Composite Map of Vulnerable Populations
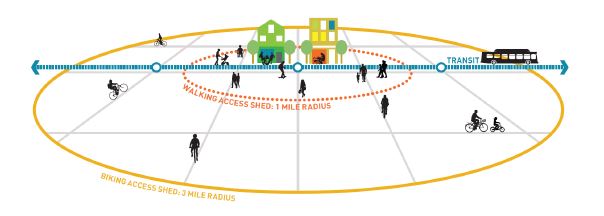
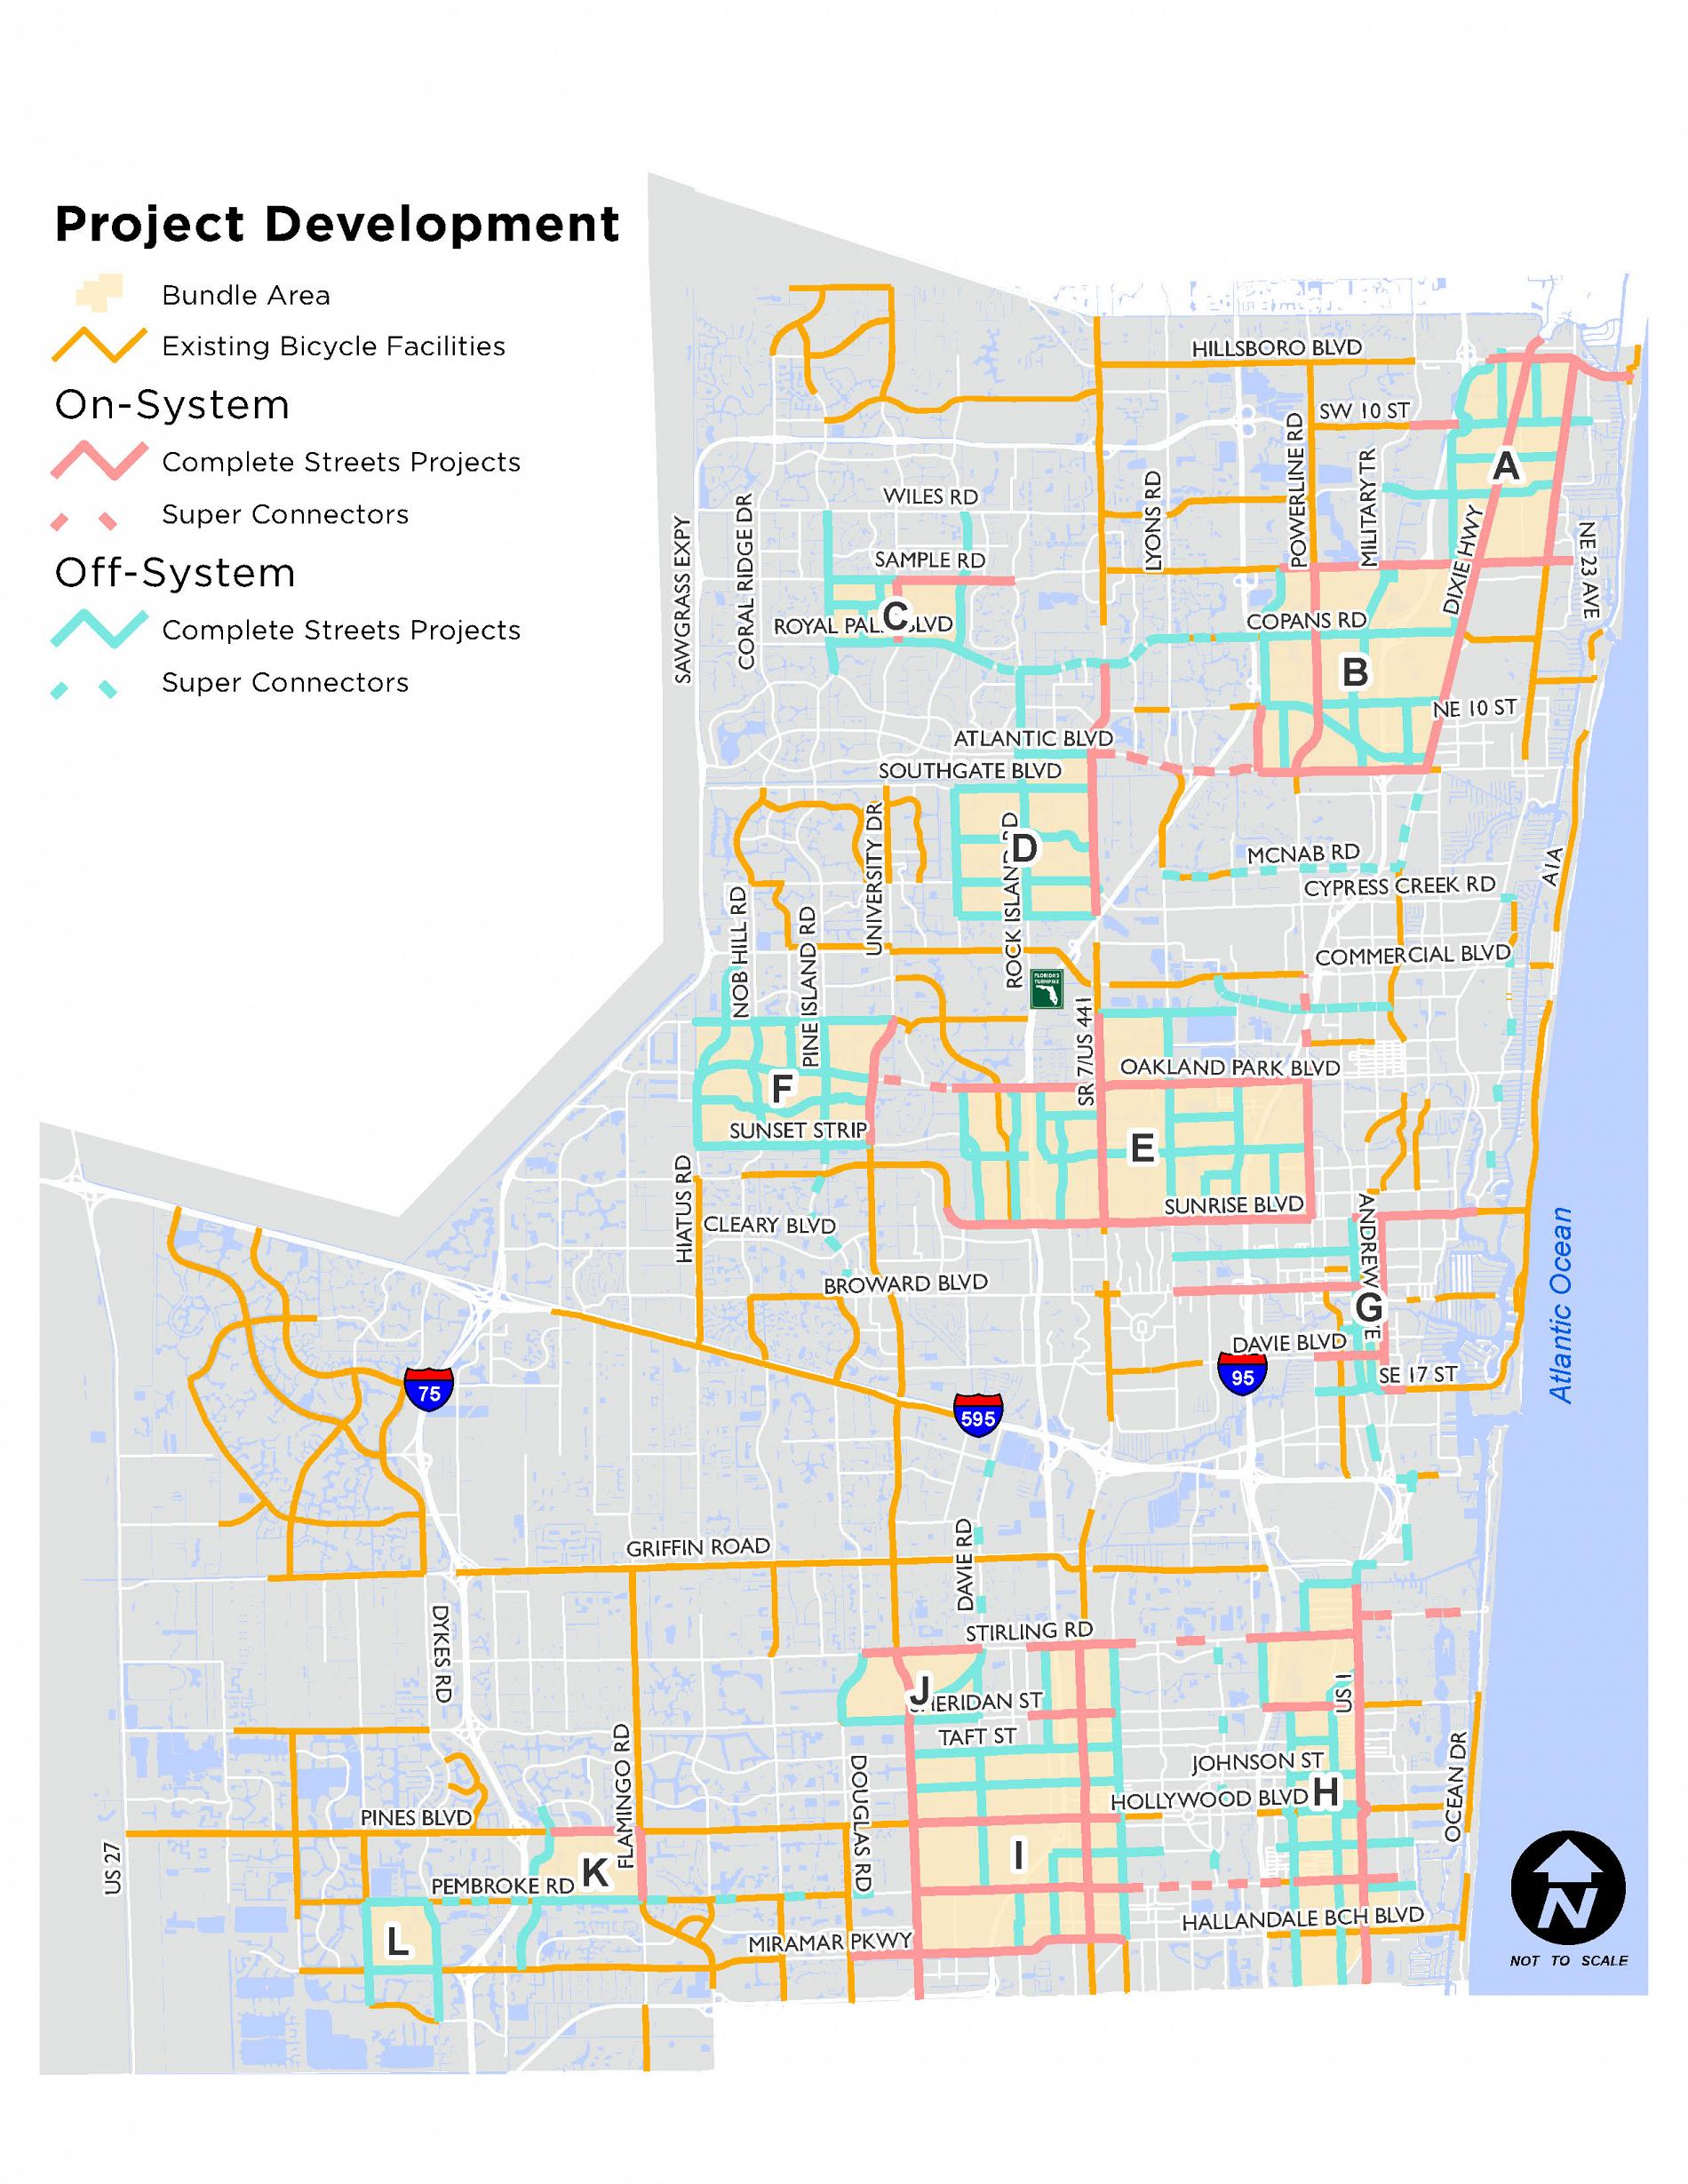
The resulting composite demand map summarizes the geographic distribution of bicycle and pedestrian demand throughout Broward County. The results of the analysis was used to help inform and prioritize potential bicycle and pedestrian project recommendations.Project Bundles were created based on the higher demand for walking and biking and high concentration of vulnerable populations. Within the Bundle Area, Complete Streets projects were identified to align the analysis with how users walk and bike within a certain distance (access shed).
Super Connectors connect the Bundle Areas and to existing facilities. They are strong, well-connected corridors that are accessible to one another. Click below to view the Bundle Areas and Super Connectors.
CSMP Proposed Projects are based on Complete Streets principles that range from sidewalks, crosswalks and bicycle lanes to complete reconstruction of certain streets creating safer streets at a human scale. Programmed projects are projects included in the Five Year Work Program that corresponds with the Complete Streets Master Plan scope of work. The projects identified are based on Complete Streets principles such as low speed design, safety improvements for all users of the street facilities.
The Complete Streets Master Plan prioritization criteria build upon the same theme as the CSLIP evaluation criteria. The criteria are consistent with the goals and objectives established in Commitment 2040 LRTP – Move People, Create Jobs, and Strengthen Communities and builds upon the format and content of the CSLIP evaluation criteria. The criteria between the two differ slightly but fit within the same theme and the maximum score for the prioritization criteria is 10.
Complete street design treats streets as part of the public realm. The features and cross section elements used in creating the street shape the public realm. Identifying the context first, establishes the general parameters for the cross section. The infrastructure tool kit, introduces streets features (Bicycle and transit facilities, enhancement pedestrian treatments) identified as part of the recommended complete street projects of the Master Plan
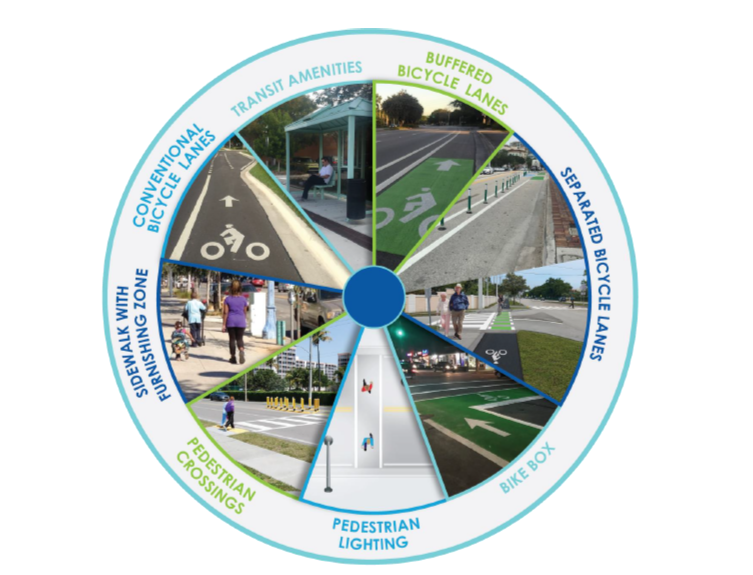
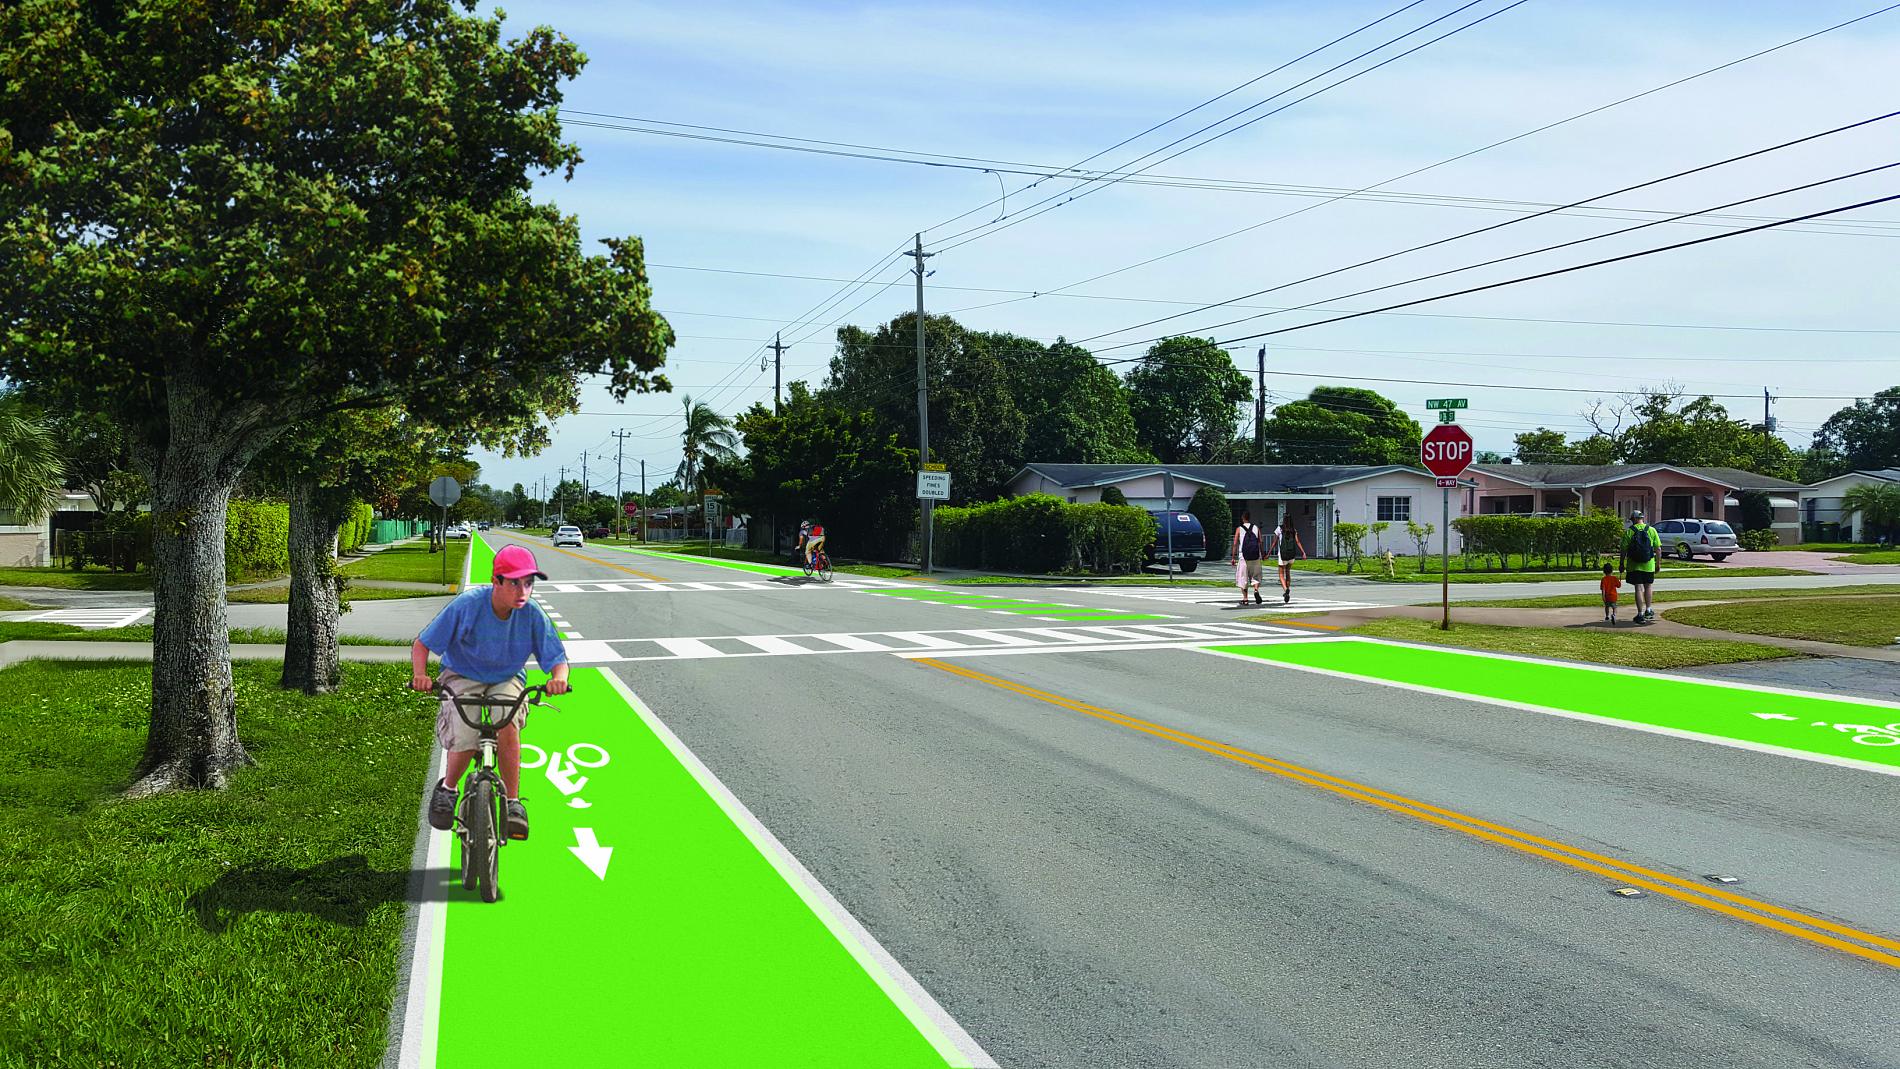
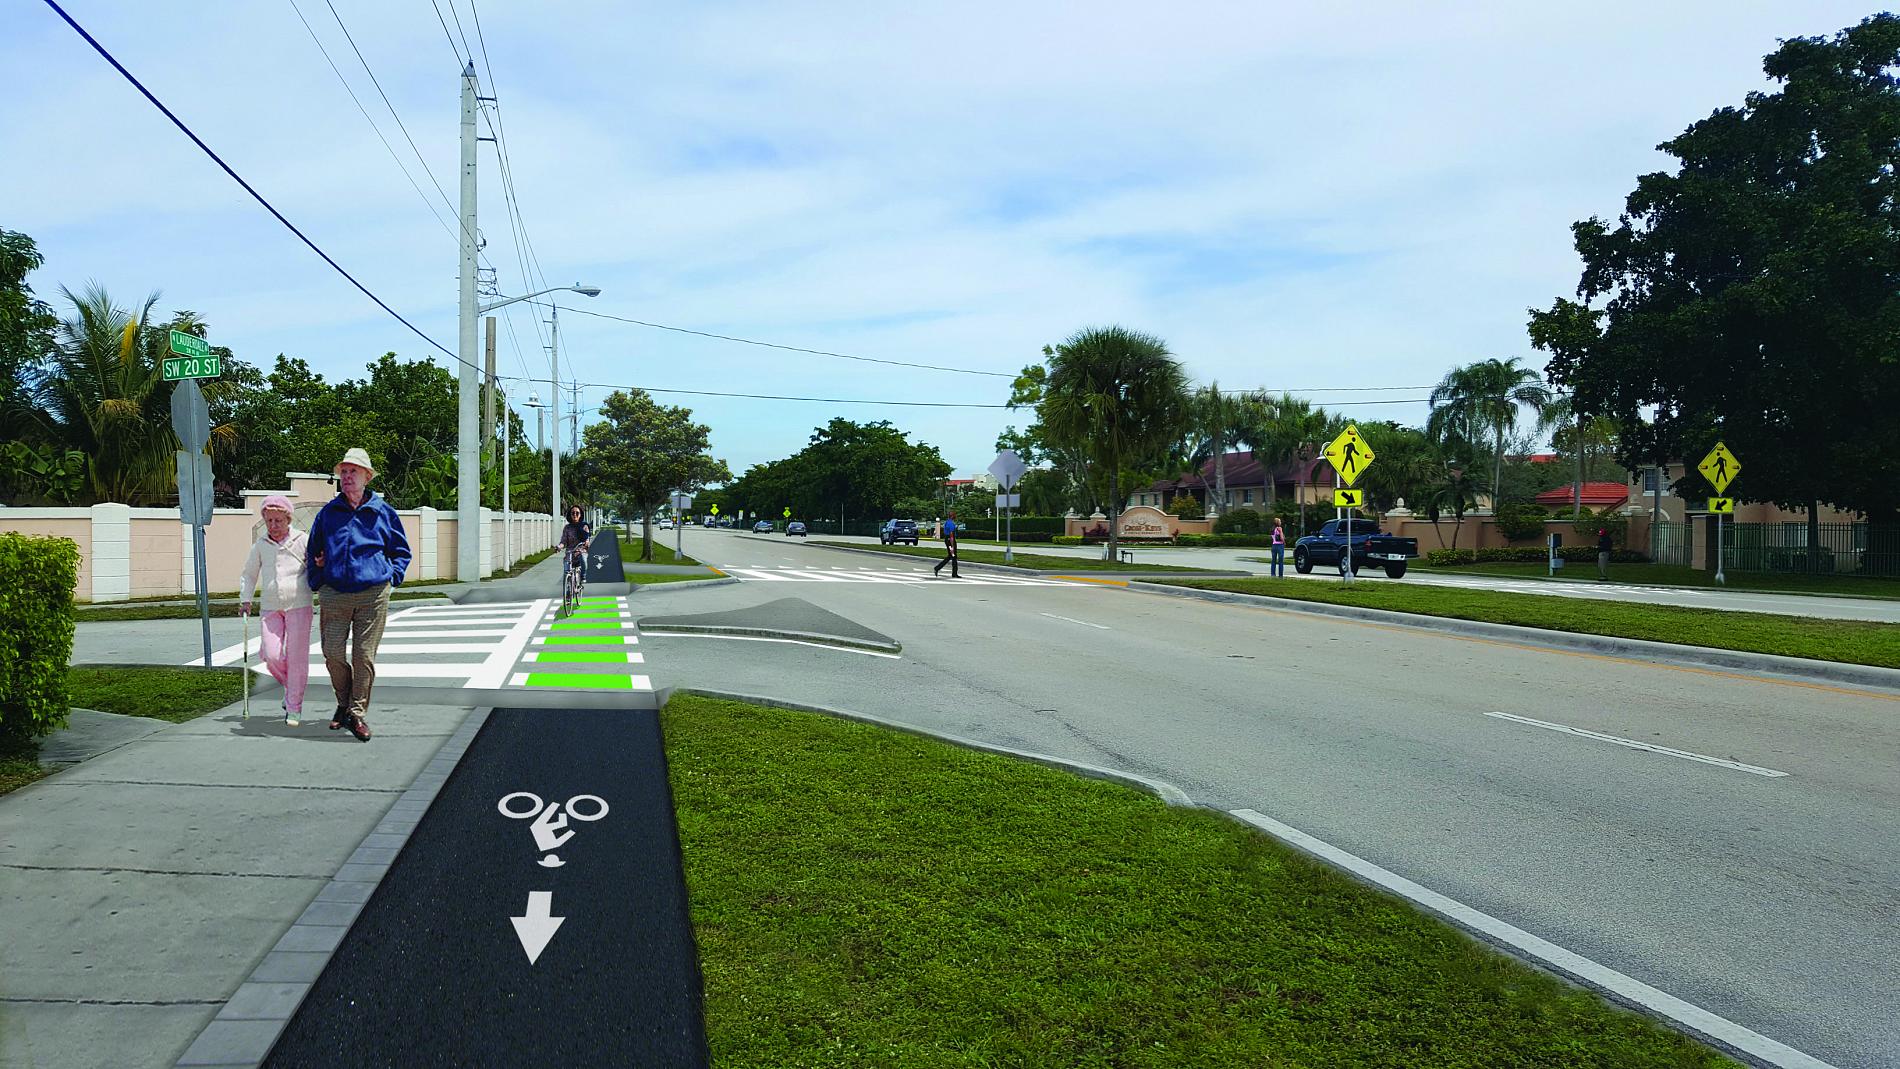
Conceptual Designs
Conceptual design graphics provides visual representation of projects implementation.
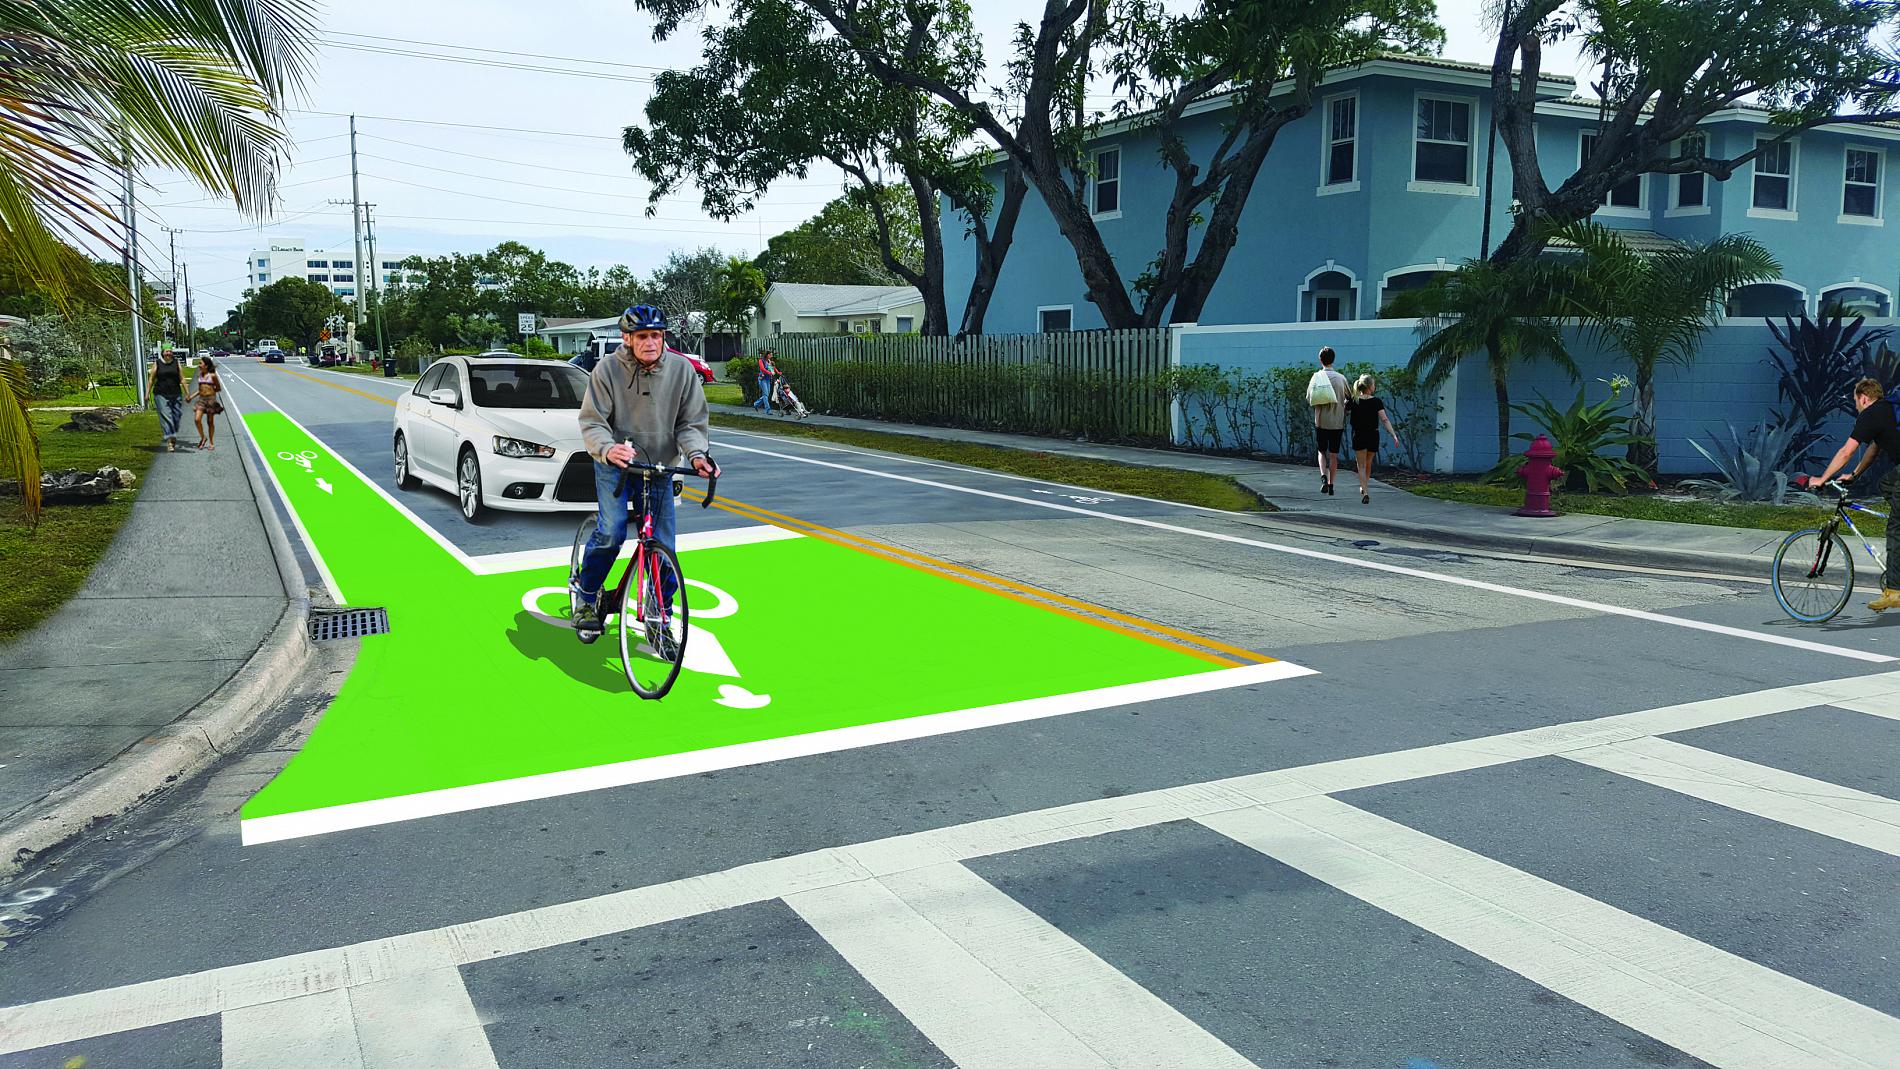
Proposed Bike Box Proposed Buffered Bicycle Lane
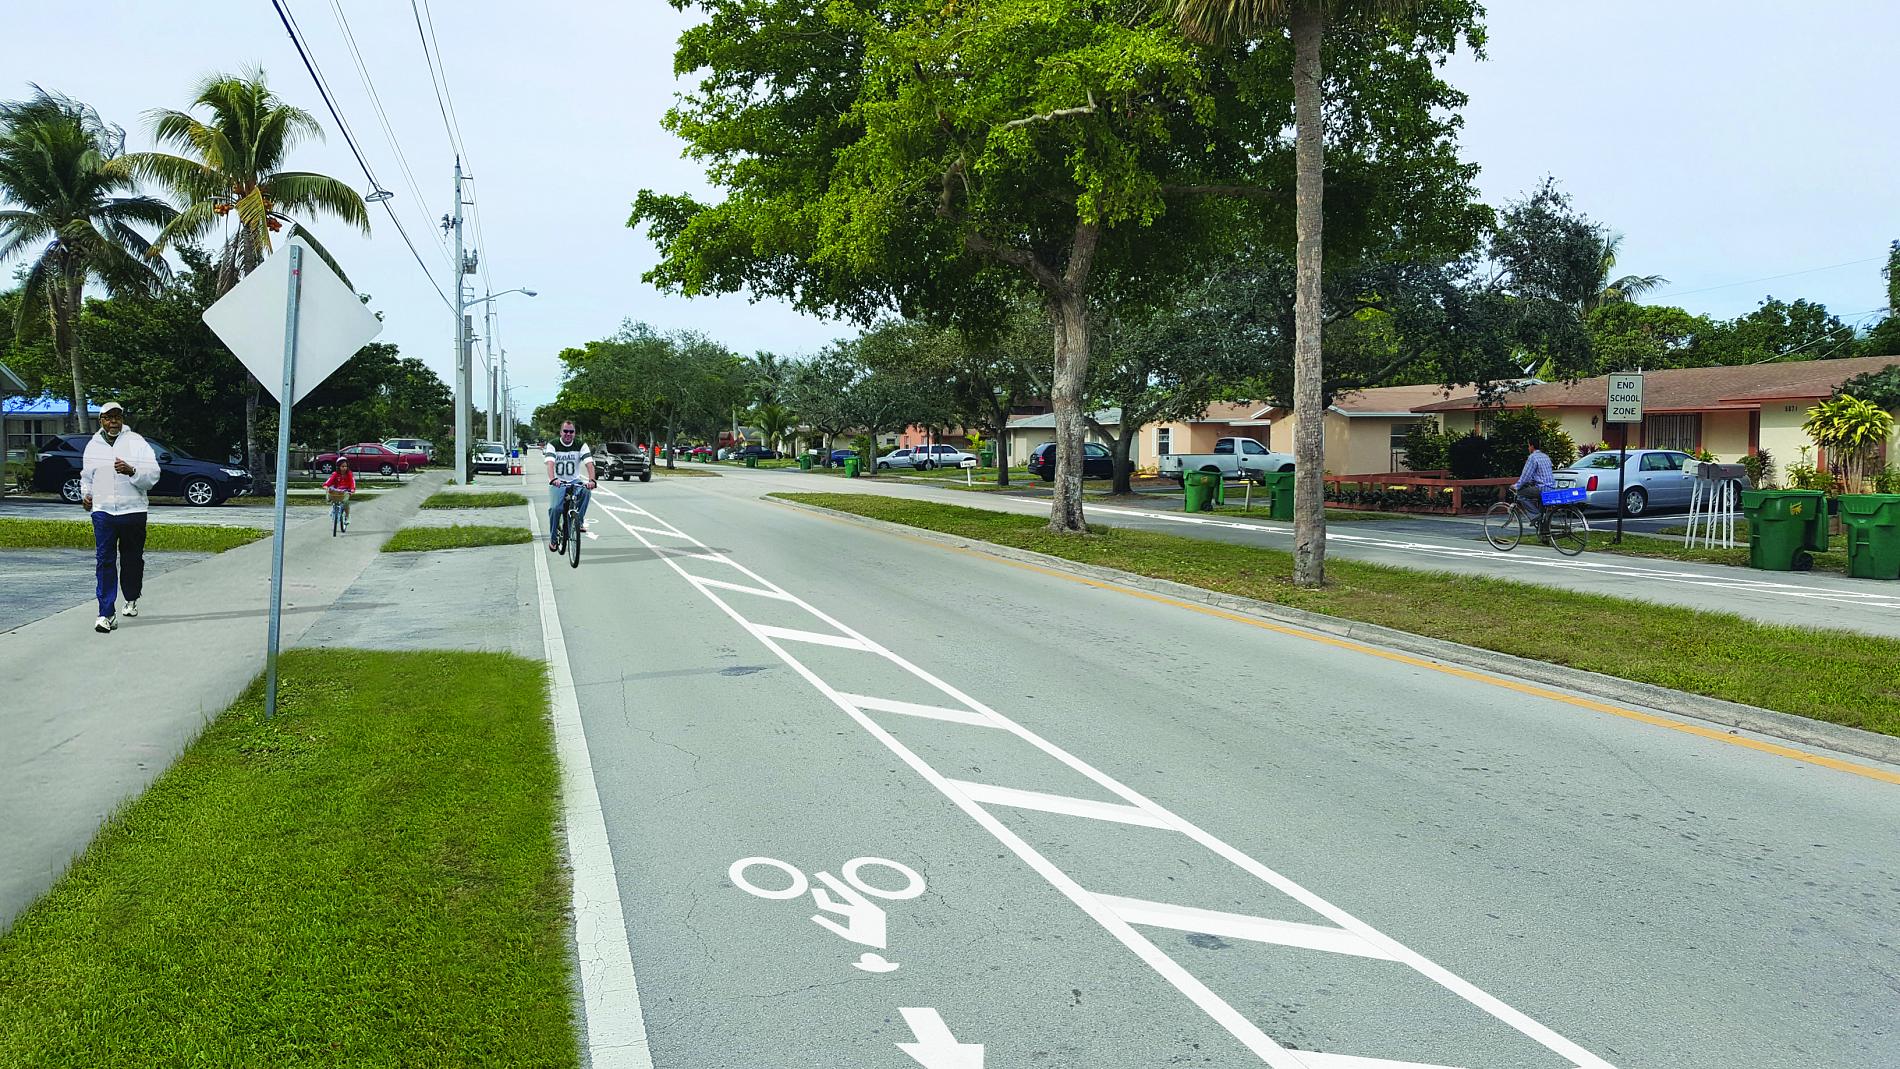
Proposed Conventional Bicycle Lane and Crosswalk Proposed Raised Separated Bicycle Lane and Crosswalk